AAAPainters for Council!
I know, the election is over and I should move on, but the fog hasn't quite lifted yet, so indulge me in one more post on the voting in the municipal election (or just stop reading, I suppose). I was surprised, receiving my ballot, to find that the names were listed in alphabetical order as opposed to random order. I figured that maybe they printed half in alphabetical order and half in reverse alphabetical order and figured that was good enough. I was quite surprised to find out after the fact that all the ballots are printed listing the names in the same, alphabetical order.
Here are the vote totals (listed in alphabetical order) for the nine non-incumbent council candidates put forward by the NPA (I excluded Peter Ladner, their one incumbent, because an incumbent would be expected to get more votes than newcomers:
ANTON, Suzanne NPA 60586
BALL, Elizabeth NPA 50865
CAPRI, Kim NPA 52719
HARDWICK NYSTEDT, Colleen NPA 46737
JENKINSON, Valerie NPA 46077
LEE, B.C. NPA 50047
LEUNG, Ronald NPA 48430
MALIHA, Patrick NPA 39165
THOMPSON, Kathi NPA 45314
In chart form:
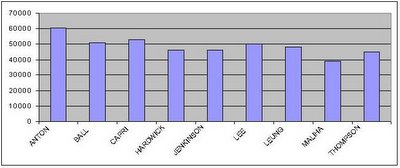
(click to enlarge)
Just looking at it with the naked eye, a fairly solid trend favouring candidates with names at the top of the ballot is visible.
Calculating the correlation (Pearson coefficient) between the order on the ballot and the number of votes received, we get a value of 0.78 (where 0 indicates no linear correlation between ballot position and vote total and 1 indicates perfect correlation between the two). 0.78 is a pretty strong correlation - the probability of getting that kind of relationship by chance is about 1 in a 100.
To get a better sense of the impact of ballot position on vote, I fit a little linear regression model to the data which suggests that the first person on the ballot could expect to get 55,646 votes, with each subsequent candidate getting 1,690 fewer votes than the last. So the second person listed gets 55,646 - 1,690 = 53,955 votes, the next person gets 53,955 - 1,690 = 52,264 votes, etc.
It's clearer if we plot the votes received and the votes predicted by our model on the same chart.
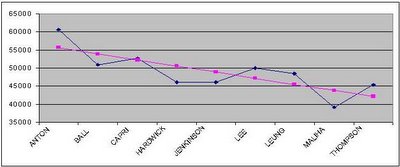
(blue line is actual vote totals, pink line is predicted based on linear regression)
For fun, we can look at the people who are off the trendline and try to explain why that might be.
For starters, Patrick Maliha, the second last NPA name on the ballot was expected not to do well, but even allowing for that, he really underperformed. The best explanation I can come up with for this is this article about him from the Tyee,
Maliha may not have seen a contradiction with a former triple-X comedian running for an establishment party with a core base of support among the socially conservative Asian community, but it seems like the NPA voters did. I'm guessing the NPA won't run any more raunchy comedians in future elections.
Alternatively, considering the next paragraph from the Tyee...
...we have to consider that voters may simply have concluded that Maliha wasn't funny.
Moving on, Elizabeth Ball was another underachiever. From the same article in the Tyee,
Maybe I'm just not being politically correct, but this story really didn't inspire me to vote for Ball, and I suspect I'm not the only one.
On a more positive note, Suzanne Anton got significantly more votes than the model predicts, topping the entire ballot and even outpolling incumbent NPA candidate Peter Ladner. My suspicion for why she outscored the model's prediction is that the model is based on a linear relationship between ballot position and votes but in fact the relationship is likely non-linear, in that it gets stronger as you get closer to the top of the ballot. In plainer language, being first on the ballot instead of second is a bigger advantage than being 5th instead of 6th which is in turn a bigger advantage than being 13th instead of 14th and so on.
The other factor, of course, is that she was probably a pretty strong candidate, having already served as park commissioner and being one of the first people I picked (starting from zero information and being fairly non-partisan) to vote for based on her record.
Like Anton, B.C. Lee and Ronald Leung both got more votes than you might expect based on the model. Since they are the only 2 Asian candidates running for the NPA, it's possible that they got a boost from that. Alternatively, it is possible that they benefited from a ballot order which clustered Ladner, Lee and Leung all in a row, positioning Lee and Leung right beside the party's strongest candidate and creating a little block of NPA candidates to draw the eye of the voter.
Again, it's entirely plausible that they were just strong candidates. I don't really agree with Leung's socially conservative views but there are probably a fair number of Vancouver voters who do, and they don't have many potential councillors to vote for.
I'm not really sure what happened to Hardwick and Jenkinson to put them below trend, although I note that if the trend is indeed non-linear as I suspect, than they wouldn't be too far off what you would expect (based on eyeballing the graph and mentally fitting a quadratic line through the data).
Anyway, the last few paragraphs were all pure conjecture on my part, but what isn't conjecture is that a simple statistical analysis suggests that there was a strong non-random correlation between how many votes you get and where you are on the ballot, quite likely enough of a connection to make the difference between who ends up on council and who doesn't. If Kathi Thompson's name was Kathi Anderson, she'd probably be one of our new councillors.
To be sure, the results from previous elections don't (at a glance) show quite as strong a pattern and maybe it's possible that this really was a 1 in a 100 case and the NPA's strongest candidates just happened to have names near the start of the alphabet, but I'm not sure there's any reason to take a chance. If 5% of Jim Green voters can vote for James Green by mistake, it seems very reasonable to think that voters have a sub-conscious tendency to vote more often for people at the top of the ballot than for those at the bottom.
At the very least, half the ballots should be printed in reverse alphabetical order, and ideally the order should be entirely randomized. Time to write (cut and paste) a letter to the city clerk's office, I think. Perhaps once I have fulfilled my civic duty, the fog will finally lift for good.
Here are the vote totals (listed in alphabetical order) for the nine non-incumbent council candidates put forward by the NPA (I excluded Peter Ladner, their one incumbent, because an incumbent would be expected to get more votes than newcomers:
ANTON, Suzanne NPA 60586
BALL, Elizabeth NPA 50865
CAPRI, Kim NPA 52719
HARDWICK NYSTEDT, Colleen NPA 46737
JENKINSON, Valerie NPA 46077
LEE, B.C. NPA 50047
LEUNG, Ronald NPA 48430
MALIHA, Patrick NPA 39165
THOMPSON, Kathi NPA 45314
In chart form:

(click to enlarge)
Just looking at it with the naked eye, a fairly solid trend favouring candidates with names at the top of the ballot is visible.
Calculating the correlation (Pearson coefficient) between the order on the ballot and the number of votes received, we get a value of 0.78 (where 0 indicates no linear correlation between ballot position and vote total and 1 indicates perfect correlation between the two). 0.78 is a pretty strong correlation - the probability of getting that kind of relationship by chance is about 1 in a 100.
To get a better sense of the impact of ballot position on vote, I fit a little linear regression model to the data which suggests that the first person on the ballot could expect to get 55,646 votes, with each subsequent candidate getting 1,690 fewer votes than the last. So the second person listed gets 55,646 - 1,690 = 53,955 votes, the next person gets 53,955 - 1,690 = 52,264 votes, etc.
It's clearer if we plot the votes received and the votes predicted by our model on the same chart.
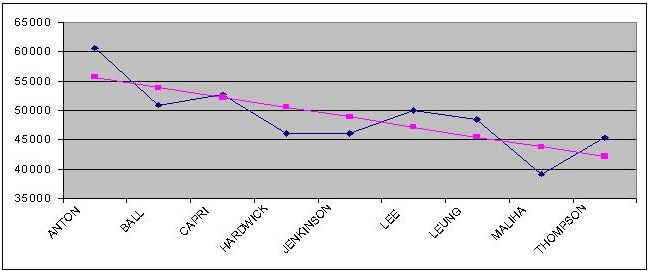
(blue line is actual vote totals, pink line is predicted based on linear regression)
For fun, we can look at the people who are off the trendline and try to explain why that might be.
For starters, Patrick Maliha, the second last NPA name on the ballot was expected not to do well, but even allowing for that, he really underperformed. The best explanation I can come up with for this is this article about him from the Tyee,
"Patrick Maliha freely admits to putting on triple-x comedy nights in the past and sees no contradiction in joining Vancouver's establishment party. He points out that underneath the dirty talk in his shows, he deals with serious issues, like Lenny Bruce or Chris Rock.
"Yes, I do a lot of dark, nasty, dirty shows," Maliha said. "I like to swear and talk about dirty subject matter. I'm dirty, but I'm dirty to get people listening."
Maliha styles himself as a citizen-politician who knows the street life, having lived in a roach-infested "bad part of town" in Ottawa 15 years ago.
"Do I have an addictive personality?" Maliha asks. "Yes. At the time, I lived to excess, but I had my epiphany. You figure out how not to be shackled by your excess. I'm running now in Vancouver to help out the Patrick Malihas of 15 years ago."
Maliha may not have seen a contradiction with a former triple-X comedian running for an establishment party with a core base of support among the socially conservative Asian community, but it seems like the NPA voters did. I'm guessing the NPA won't run any more raunchy comedians in future elections.
Alternatively, considering the next paragraph from the Tyee...
"All seriousness aside, does he have jokes about the current campaign?
"Oh I don't want to be cruel," Maliha says. "I'd never say something like Jim Green has an uncanny resemblance to Jabba the Hut. I'd never say that they call him Jimmy the Hut. Never."
...we have to consider that voters may simply have concluded that Maliha wasn't funny.
Moving on, Elizabeth Ball was another underachiever. From the same article in the Tyee,
"[Ball] had to answer whether she can focus mentally and stand up to the demanding life of a city councillor, after a history of injuries and shopping accidents cancelled her theatre career.
Ball was awarded $330,000 from the Gap in B.C. Supreme Court for damages suffered when a mannequin fell on her in a Vancouver store. Previous to her 1996 Gap mishap, Ball was knocked out cold and suffered headaches and neck spasms when a chandelier dropped on her in lighting store in 1991.
In court documents from Ball's 2001 civil trial against the Gap, the judge reasons, based on medical evidence, it is unlikely Ball will be able to return to work and thus deserves the large cash award.
"Given her age and lack of training and experience it is also unlikely that she will be able to find other employment," writes Madam Justice Ross. "Unfortunately, I think that it is likely that the plaintiff will be permanently unable to work." Gap appealed, but the ruling was upheld in 2002.
Ball says she has overcome cognitive damage through working with therapists and adds she thinks it's sad her critics would rather question her mental faculties than celebrate her rehabilitation efforts."
Maybe I'm just not being politically correct, but this story really didn't inspire me to vote for Ball, and I suspect I'm not the only one.
On a more positive note, Suzanne Anton got significantly more votes than the model predicts, topping the entire ballot and even outpolling incumbent NPA candidate Peter Ladner. My suspicion for why she outscored the model's prediction is that the model is based on a linear relationship between ballot position and votes but in fact the relationship is likely non-linear, in that it gets stronger as you get closer to the top of the ballot. In plainer language, being first on the ballot instead of second is a bigger advantage than being 5th instead of 6th which is in turn a bigger advantage than being 13th instead of 14th and so on.
The other factor, of course, is that she was probably a pretty strong candidate, having already served as park commissioner and being one of the first people I picked (starting from zero information and being fairly non-partisan) to vote for based on her record.
Like Anton, B.C. Lee and Ronald Leung both got more votes than you might expect based on the model. Since they are the only 2 Asian candidates running for the NPA, it's possible that they got a boost from that. Alternatively, it is possible that they benefited from a ballot order which clustered Ladner, Lee and Leung all in a row, positioning Lee and Leung right beside the party's strongest candidate and creating a little block of NPA candidates to draw the eye of the voter.
Again, it's entirely plausible that they were just strong candidates. I don't really agree with Leung's socially conservative views but there are probably a fair number of Vancouver voters who do, and they don't have many potential councillors to vote for.
I'm not really sure what happened to Hardwick and Jenkinson to put them below trend, although I note that if the trend is indeed non-linear as I suspect, than they wouldn't be too far off what you would expect (based on eyeballing the graph and mentally fitting a quadratic line through the data).
Anyway, the last few paragraphs were all pure conjecture on my part, but what isn't conjecture is that a simple statistical analysis suggests that there was a strong non-random correlation between how many votes you get and where you are on the ballot, quite likely enough of a connection to make the difference between who ends up on council and who doesn't. If Kathi Thompson's name was Kathi Anderson, she'd probably be one of our new councillors.
To be sure, the results from previous elections don't (at a glance) show quite as strong a pattern and maybe it's possible that this really was a 1 in a 100 case and the NPA's strongest candidates just happened to have names near the start of the alphabet, but I'm not sure there's any reason to take a chance. If 5% of Jim Green voters can vote for James Green by mistake, it seems very reasonable to think that voters have a sub-conscious tendency to vote more often for people at the top of the ballot than for those at the bottom.
At the very least, half the ballots should be printed in reverse alphabetical order, and ideally the order should be entirely randomized. Time to write (cut and paste) a letter to the city clerk's office, I think. Perhaps once I have fulfilled my civic duty, the fog will finally lift for good.
posted by Declan at
Wednesday, November 23, 2005
![]()


8 Comments:
While I don't disagree with your conclusion that the order of names on ballots should be randomized, I have to take serious issue with your statistical analysis. For example, you write that "the probability of getting that (level of correlation) by chance is about 1 in a 100." How did you obtain that probability? Moreover, I'm not sure that it's particularly meaningful to perform linear regression against an ordinal predictor (alphabetical rank order), especially for a sample size of only 9!
It's more important to determine first whether there is a significant difference among the nine vote totals. So, comparing them to the sample mean (48882.2 votes), I performed a T-test. The result? The differences from the mean are not significant: indeed all but the results for Anton fall within two standard deviations from the mean. (The differences are so insignificant that a P-value of 1.0 was produced.) As it turns out, Anton's results fall outside the 95% confidence bound, but it's not a statistically valid interpretation to conclude that this is a result of her name appearing first on the ballot.
By JG, at 9:10 PM
The one in a hundred is based on the p-value for a hypothesis test that there is no correlation, or, equivalently, that the 'slope' coefficient in the linear regression is 0.
As you can see here, with a correlation of .78 and nine data pairs (7 degrees of freedom), the p value is in the range of .01 or 1 in a hundred.
I'm not really sure what you're measuring with your t-test. The data could have a perfect correlation (i.e. the pink line) and still you wouldn't get a significant result. It just means the slope is not steep (or there aren't a lot of data points).
It's not surprising that your biggest deviation from the mean is on one of the endpoints - that's what you'd expect if there was a trend. If we had more data points then presumably we'd have greater deviations from the mean (positive at one end, negative at the other). What I'm saying is, the information value in this data is in the trend, not in the variance.
I mean, just looking at the chart you can tell there's at least a somewhat significant trend there.
It's a reasonable question about whether the data is ordinal or continuous (which I implicitly acknowledged by first using a bar chart, then switching to a line chart) but I think my approach is reasonable (for this sort of rough back of the envelope calculation, I'm not writing a thesis or anything), since basically it is just an assumption that the impact of being moved one spot down on the ballot is the same no matter where you are in the ballot - which is not perfect but still good enough to fit a line through the data which captures a significant portion of the variation.
The real problem with treating it as continuous is that I didn't allow for all the non-NPA candidates on the ballot. If I was trying to be really precise I would have also tried doing it using the absolute position on the ballot (including all the candidates) not just the relative position of each candidate among the NPA slate. I doubt it would change my conclusions much though.
By Declan, at 10:17 PM
The question of whether the predictor variable is ordinal or continuous is, in fact, fundamental. Simply put, linear regression will not give meaningful, much less valid, results from a sample size of 9, since a linear regression model assumes that the predictor variable is continuous. Correlation, meanwhile, and the P-values associated with it, is an identical measure of a linear relationship. If there were nonlinear effects, it would be invalid.
Rather than linear regression, the appropriate procedure would be a one-factor analysis of variance, with alphabetical rank order as the factor in question. For this to work, you'll also need more samples, since with these, there is only one sample of size one for each factor level.
I'm not trying to be overly anal about this, but statistical methods are misused with alarming frequency. While I think that there may something to your hypothesis, you have not applied the statistical analysis correctly. All these methods are limited by the fact that the models that underlie them entail certain assumptions which, if violated, cause the model to be inapplicable.
(The point of the T-test, by the way, was to examine whether the variation in the levels of votes received was significant - it wasn't - which suggests that we can draw few conclusions from these results, since, as I said above, linear regression is not appropriate in this case.)
Now, I do have an idea of a way of studying the effect of alphabetical order on voting. Suppose we prepare 10 ballots of five names each listed in alphabetical order. Then assign sets of 10 of these ballots to 30 people, who will then be asked to vote for one person on each ballot. I'll have to think about how to characterize this design...
By JG, at 1:08 PM
Josh, I hear what you're saying, I just don't think that the fact that I have treated the ballot position as continuous is that big a deal (or all that unusual).
See here for some brief, to the point, discussion of the topic.
The measure of correlation wouldn't really be 'invalid' if there is a non-linear relationship (which we don't really know if there is or not) it would just tend to be lower since correlation is looking for a linear relationship. The p-value might be off a little, but I doubt by much. For all my speculation that there might be a non-linear component to the data, if there is one there it is masked by other factors (such as some candidates being stronger than others) and can't really be easily seen in the data. Looking at the graph, maybe there is some kind of sloping sin-wave relationship but I think that might be over-fitting!
Finally, I'm sure you could construct an experiment with cleaner data, but I suspect the uncertainty created by not knowing whether your experimental results translate into a real election would exceed the statistical uncertainty in my approach of just looking at the actual data we do have. It would still be interesting though.
By Declan, at 2:49 PM
For the type of regression you were performing, ordinal independent variables are not permitted. And while the correlation coefficient itself is fine, the p-value associated with it is obtained from the linear regression analysis, and hence not relevant.
You're right that an experimental study would not necessarily reflect what happens when people vote in an election, but since we wish to test the hypothesis of whether people will tend to choose names at the top of the list, it will give a truly experimental (and randomized) conclusion from which we can make useful interpretations.
One thing you could easily do would be to obtain the results for other Lower Mainland cities like Burnaby (you would want several more samples at least). Assign the number of the alphabetical order to each name, and then run a single-factor Analysis of Variance with the alphabetical rank order as the factor.
By JG, at 6:37 PM
It's not ordinal, it's continuous (in the eyes of the model). The question, as was pointed out in my link in the last comment, is if the intervals between the values are really the same (i.e. does it behave like interval data), and I think that in this case it does (or is close enough).
I could look at other cities, or look at the past results for Vancouver but I'd still do a linear regression (or some kind of trend analysis). ANOVA doesn't make any sense because I am looking for a trend.
By Declan, at 7:07 PM
being first on the ballot instead of second is a bigger advantage than being 5th instead of 6th ...
That would be so because not all voters use all their votes, right?
What a crazy electoral system--independent of the way names are ordered on the ballot.
By Anonymous, at 10:57 AM
That - and because I figure if people are willing to look halfway down they are probably going to go all the way.
It's just a theory on my part, don't know if its true. Could be that being 6 vs. 5 is just as much a disadvantage as 2 vs. 1.
Either way, likey you say, it's quite a system - and quite a ballot (imagine a piece of legal sized paper filled with names on one side and text (the spending questions) on the other).
It felt like filling in all the little ovals with my pen (votes are tabulated electronically) took me a good 10 minutes!
By Declan, at 12:50 PM
Post a Comment
<< Home