No Excuses
As a Leafs fan, who is also a Canucks fan, I couldn't help noticing that the Leafs are well behind last season's point total and the Canucks are slightly behind last season's point total. Thinking about why, it seemed reasonable that the Leafs, with one of the league's highest payrolls, would have had to make significant cuts to get under the salary cap, and the Canucks, with a fairly high payroll, have had to make cuts as well, albeit not as many.
So it seemed a plausible theory that any given team's change in points, season over season, would be negatively correlated with their payroll last season. That is, teams with a high payroll going into the cap era would suffer while those with a low payroll going into the cap era would benefit.
It seemed reasonable, but it doesn't appear to actually be true.
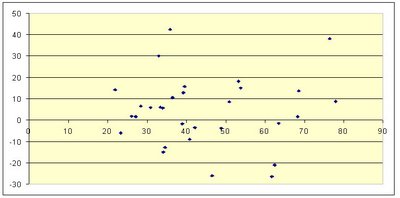
The following chart plots change in points year over year from 2003-04 to 2005-06 (on the y axis, 2005-06 point total projected based on the standings through Friday, March 10), against payroll for 2003-04 (on the x axis, in millions). As you can see, there doesn't seem to be much, if any, correlation between the two. Even if we were to write off the NY Rangers (the point in the top right of the graph, since they had one of the league's highest payrolls and have also had one of the biggest improvements despite having to shed tens of millions in salary) as some kind of aberration, there still is little evidence to support my theory.

So perhaps the struggles of the Leafs and Canucks are just down to bad management, and the cap is no excuse.
-----
On the plus side, the Canucks (Marc Crawford) have started to give the Sedin's more ice time (and suddenly the media figures they have stepped up their play) and they are both up over 16 minutes a game, although they still lead the league in scoring if you only include players who get the same ice time or less than they do. Other players scoring well despite (relatively) limited ice time include Datsyuk, Hemsky, Shanahan, Andy Macdonald, and the underrated Marek Svatos, who had 50 points in 61 games (and led the league with 9 game winners) despite only averaging 13:44 of ice time. The Av's will miss him in the playoffs (he is out until the fall due to shoulder surgery).
So it seemed a plausible theory that any given team's change in points, season over season, would be negatively correlated with their payroll last season. That is, teams with a high payroll going into the cap era would suffer while those with a low payroll going into the cap era would benefit.
It seemed reasonable, but it doesn't appear to actually be true.
The following chart plots change in points year over year from 2003-04 to 2005-06 (on the y axis, 2005-06 point total projected based on the standings through Friday, March 10), against payroll for 2003-04 (on the x axis, in millions). As you can see, there doesn't seem to be much, if any, correlation between the two. Even if we were to write off the NY Rangers (the point in the top right of the graph, since they had one of the league's highest payrolls and have also had one of the biggest improvements despite having to shed tens of millions in salary) as some kind of aberration, there still is little evidence to support my theory.

So perhaps the struggles of the Leafs and Canucks are just down to bad management, and the cap is no excuse.
-----
On the plus side, the Canucks (Marc Crawford) have started to give the Sedin's more ice time (and suddenly the media figures they have stepped up their play) and they are both up over 16 minutes a game, although they still lead the league in scoring if you only include players who get the same ice time or less than they do. Other players scoring well despite (relatively) limited ice time include Datsyuk, Hemsky, Shanahan, Andy Macdonald, and the underrated Marek Svatos, who had 50 points in 61 games (and led the league with 9 game winners) despite only averaging 13:44 of ice time. The Av's will miss him in the playoffs (he is out until the fall due to shoulder surgery).


0 Comments:
Post a Comment
<< Home